How to Measure Search Effectiveness: A Step-By-Step Guide

By Roman
April 19 2024
20min to read

Does your search function feel like a black hole, swallowing queries and spitting out frustration? Do you suspect valuable leads are disappearing into the search abyss, never to be seen again? Or how to measure search effectiveness?
Stop guessing and start knowing! Google Analytics 4 (GA4) can be your flashlight, illuminating user search behavior and revealing what needs improvement.
In this blog post, you'll learn how to set up site search tracking in GA4. We'll also explore optimization strategies to turn your search function from a frustrating void into a user-friendly portal that drives conversions. Get ready to transform your website search into a powerful tool for attracting and retaining happy customers.
Step 1: Preparing for Site Search Analysis and Optimization
Before we delve into GA4 and figure out how to measure search effectiveness, let's solidify your search goals. What's the ultimate purpose you envision for your site search? Is it to boost conversions to new heights, minimize user exits after searches, or streamline the search refinement process? The key is to craft goals that are SMART:
By setting SMART goals, you lay the ground for your overall analysis of the site search and further optimization.
- Specific: Clearly define your desired outcome. Aim for a 10% increase in search result click-through rate (CTR), for example.
- Measurable: Quantify your goals for easy tracking. A 10% CTR increase allows you to measure progress and success.
- Achievable: Be ambitious but realistic. Consider your website traffic, current search performance, and resources. A 10% CTR increase from 5% within three months might be achievable.
- Relevant: Align search goals with your overall website objectives. Is user experience improvement the focus? Target a reduction in "no results" searches and search refinement rates.
- Time-bound: Set a timeframe. Reduce "no results" searches by 15% in the next quarter, for example. This allows you to measure progress over time.
By setting SMART goals, you lay the ground for your overall analysis of the site search and further optimization.
Choosing the Right Site Search Metrics
Not all website search metrics play nice with GA4 yet. Setting up Search Term tracking is a breeze, but others remain elusive. This isn't surprising, as configuring metrics from Universal Analytics can be tricky in GA4. However, there's good news! We can still track those missing metrics using other Google tools. Before diving in, let's explore which metrics are GA4-friendly and which require a different approach.
Can Be Set Up In GA4
Search Terms
Search terms reveal what users are actively seeking in your store. This data eliminates guesswork, helping you optimize your online store's efficiency. With that data you can identify high-demand products and remove unpopular ones or refine product descriptions for better search relevance.
While GA4 currently provides basic data through the "view_search_results" event, it doesn't reveal specific search terms. We'll explore how to unlock this valuable data in the next section.
Time Spent on Search Results Page
Do you know how much time people spend on the search results page in your store? It’s quite a viable metric that indicates how long users spend reviewing results. A short time suggests irrelevant results or poor search experience.
Can Be Tracked via Google’s Products
Here are the old metrics available in Google Universal Analytics that can be found and tracked but not set up in GA4.
Sessions with Search
The metric focuses purely on quantity. It tells you the raw number of website visits (sessions) where someone used the site's search function at least once. It generally shows how many users actively seek information, potentially indicating navigation issues or a complex site structure if the number is high.
Percentage of sessions that used internal search
The metric takes things a step further. It calculates the portion of total website visits that involved a search. This helps you understand how prevalent search is among your visitors. A high percentage might suggest site issues or struggling to find the intended item.
Total Unique Searches
The metric provides a clear picture of overall search bar usage on your website. It meticulously tracks the number of distinct search submissions, eliminating the clutter of repetitive searches within the same session. This metric empowers you to gauge how frequently users are actively engaging with your search bar.
Results Pageviews / Search
The metric delves into user engagement after a search. It calculates the average number of search result pages a user views after initiating a search. It helps you understand how deeply users explore results on average.
Search Exits
The metric focuses on negative outcomes. It counts the number of times a user performed a search and then immediately left the website. This could signify frustration with search results or a lack of relevant information.
Percentage of Search Exits
The metric refines the previous one. It calculates the proportion of searches that led to the user leaving the site.
Search Refinements
The metric analyzes user actions after seeing search results. It counts the number of times a user performs a new search immediately after viewing results from a previous search. This shows how often users need to refine their search terms, a high number potentially suggests ambiguity or unhelpful filters.
Percentage Search Refinements
The metric provides a deeper perspective on search refinements. It calculates the percentage of times viewing search results leads users to refine their search terms.
Time after Search
The metric shows the average time users remain browsing after initiating a search. This data reveals whether users are finding what they're looking for and staying engaged on your site.
Search Depth
The metric analyzes how users navigate your website after initiating a search. It unveils the average number of pages viewed, letting you know how thoroughly users explore search results. A high number could be a sign of complex information architecture or insufficient search result filtering.
Check out this page to learn more about the formulas behind these metrics.
You must be eager to learn your metrics. Let’s not rush and set up GA4 first.


Step 2: Google Tracking Implementation
Unlocking valuable insights from your site search requires proper tracking setup within Google Analytics 4 (GA4). Here's a step-by-step guide to get you started:
1.GA4 Property Initialization (if not previously established):
- Start by setting up GA4.
- Then generate a new Google Analytics 4 property designated specifically for your Shopify domain.
- Critical Note: Ensure the configuration of a data stream within your GA4 property to facilitate the seamless flow of data from your Shopify platform.
2.Integration of GA4 with Shopify:
- Access Shopify Administrative Panel: Navigate to the Online Store > Preferences section within your Shopify administrative interface.
- Initiate Google Integration: Within the designated "Google Analytics" segment, select "Set Up Google" to commence the integration process.
- Google Account Linkage: Adhere to the presented prompts to establish a connection with the Google account associated with your GA4 property.
- GA4 Property Selection: Designate the specific GA4 property and corresponding Tag ID that will be linked to your Shopify store for data aggregation and analysis.
- Connection Finalization: Click "Connect" to formally establish the link between your Shopify platform and the selected GA4 property.
3.Data Synchronization Period:
- Following the successful connection establishment, a period of up to 24 hours is required for the commencement of data transmission from your Shopify store to your GA4 property.
- This timeframe is essential for ensuring the accurate synchronization and alignment of data across both platforms.
Set Up Search Terms
Recall our previous discussion on the search terms within the "view_search_results" event? It's time to shed light on this hidden data and unlock its potential!
1.Empowering GA4 with Custom Dimensions:
- Access the Customization Hub: Navigate to Admin and then delve into the Custom Definitions.
- Create a New Dimension: Select Create Custom Dimensions and let's bring your search terms to life.
- Naming the Dimension: Choose a descriptive name like "search_terms" or "site_search_queries" - this is how your data will be presented in reports.
- Setting the Scope: Ensure the scope is set to Event as we're dealing with search term events.
- Optional Description: Feel free to add any additional information in the description field, though it's not mandatory.
- Linking the Event Parameter: In the Event Parameter field, type "search_term" and select the corresponding option from the drop-down menu. This precise parameter is key to capturing those valuable search terms.
2.Patience is Key:
- Allow 24 hours for the custom dimension to weave its magic and start collecting data.
- Once the waiting period is over, head to Reports > Engagement > Events > view_search_results.

There is another way to display search queries in GA4 in a separate report:
1.Constructing a Search Term-Specific Report:
1.Constructing a Search Term-Specific Report:
- Access Report Interface: Navigate to the Reports section within GA4, followed by the Engagement category, and finally, the Events subsection.
- Initiate Report Customization: Locate and select the Pencil icon situated in the upper right corner to enable report modification.
- Dimension Refinement: Within the Dimensions section, remove the "Event Name" dimension to focus exclusively on search term data.
- Incorporate Search Term Dimension: Add the Search Term dimension and click Apply to prioritize this data point within the report.
- Select Relevant Metrics: Access the Metrics section and ensure the inclusion of the following metrics for comprehensive analysis:
- Event Count: Quantifies the frequency of individual search term usage.
- Event Count Per User: Provides insights into the average number of times each user employs specific search terms.
- Users: Identifies the unique number of users engaging with the site's search functionality.
- Finalize Metric Selection: Click Apply to confirm the chosen metrics for the report.
- Save and Assign Report Name: Save the newly created report with a clear and identifiable title such as "E-commerce Search Term Analysis" for ease of reference.
2.Organizing the Report within the GA4 Library:
- Access Library Section: Navigate to the Library section within GA4.
- Modify Life Cycle Collection: Locate the Life Cycle collection and select "Edit Collection" to enable modifications.
- Position Report: Drag the newly generated "E-commerce Search Term Analysis" report from the right-hand column to the left-hand column to enhance its visibility and accessibility.
- Confirm Modifications: Click Save followed by "Save changes to the current collection" to implement the changes.
3.Accessing the Dedicated Search Term Report:
- Return to Reports Interface: Navigate back to the Reports section.
- Select Engagement Category: Choose the Engagement category.
- Access Search Term Report: The custom-built "E-commerce Search Term Analysis" report will now be readily accessible for in-depth analysis of customer search behavior within your online store.

Beyond the previously established methods, Google Analytics 4 (GA4) presents a third, arguably more streamlined, approach to analyzing search term data: leveraging the Free Form exploration technique.
1.Access Exploration Interface: Navigate to the Explore section within GA4 and select the Free Form exploration template.
2.Configure Variables:
1.Access Exploration Interface: Navigate to the Explore section within GA4 and select the Free Form exploration template.
2.Configure Variables:
- Dimensions: Add the Search Term dimension to analyze individual search queries.
- Metrics: Include both Event Count Per User and Total Users metrics to quantify search term usage and user engagement.
3.Refine Exploration Settings:
- Rows: Remove any existing settings and add the Search Term dimension to display raw search term data.
- Values: Incorporate both Event Count Per User and Total Users metrics to provide quantitative context to the search term data.
4.Apply Filter: Set a filter where the Event Name exactly matches "view_search_results" to ensure the analysis focuses solely on search-related events.
5.Assign Exploration Name: Rename the exploration to a descriptive title such as "Free Form Search Term Analysis" for ease of identification.
6.Utilizing the Free Form Exploration for Insights:
5.Assign Exploration Name: Rename the exploration to a descriptive title such as "Free Form Search Term Analysis" for ease of identification.
6.Utilizing the Free Form Exploration for Insights:
- Identify Trending Search Terms: Discover which search terms are most frequently used by customers, indicating potential areas of interest and demand.
- Analyze User Engagement with Search: Evaluate how effectively the search functionality facilitates product discovery and engagement.
- Optimize Product Visibility: Refine product titles, descriptions, and categorization based on prevalent search terms to enhance product visibility within the online store.

That's it as far as search terms are concerned, you can customise them to your liking using the three main ways described above.
Set Up Time Spent on the Search Results Page
Now let's look at how you can track the time your customers spend on the search results page.
1.Configuring the Free Form Exploration:
1.Configuring the Free Form Exploration:
- Access Exploration Functionality: Navigate to the Explore section within your GA4 property and select the Free Form exploration template to initiate the analysis process.
- Variable Specification:
- Dimensions: Include both the Page Title and Screen Class dimensions to identify specific search results pages and differentiate them from other page types within the online store.
- Metrics: Add the Sessions and Average Engagement Time per Session metrics to quantify user visits to search results pages and measure the average duration of engagement during each session.
2.Exploration Settings Refinement:
- Rows: Remove any existing settings and add both the Page Title and Screen Class dimensions to display raw data pertaining to search results pages.
- Values: Incorporate the Sessions and Average Engagement Time per Session metrics to provide quantitative context regarding user visits and engagement duration on these pages.
3.Filter Application (Optional): Consider implementing a filter to isolate specific search results pages or categories based on page title or screen class criteria for a more granular analysis.
4.Exploration Naming: Assign a descriptive title to the exploration, such as "Search Results Page Engagement Analysis," for ease of identification and future reference.
4.Exploration Naming: Assign a descriptive title to the exploration, such as "Search Results Page Engagement Analysis," for ease of identification and future reference.

Tracking Metrics in Google Looker Studio
Setting up and tracking old metrics from Google Universal Analytics is challenging and requires some technical knowledge. Without further ado, let’s get started.
Now, you need to connect GA4 to BigQuery and Looker Studio to build a custom dashboard. This dashboard will house key metrics previously available in your Site Search reports.
Connect GA4 to BigQuery
BigQuery is Google’s database that allows you to retrieve data using SQL commands. It’s a great platform for building reports or sharing data with other platforms so you can visualize data beautifully.
Before you start connecting services, make sure you have configured BigQuery if you haven't already.
1.Verification Step:
- Access Google Cloud Console: Navigate to the Google Cloud Console for your project.
- Locate IAM & Admin Section: Within the Quick Access section situated beneath the project description, select IAM & Admin.
- Identify Service Account: Within the IAM & Admin panel, review the list of accounts with assigned roles to verify the presence of the following service account: firebase-measurement@system.gserviceaccount.com
- Validate Role Assignment (if service account exists): Ensure that the identified service account possesses the BigQuery User role, granting the necessary permissions to interact with BigQuery resources.
2.Granting Access Step (if service account is absent):
- Initiate Access Granting Process: Click on the Grant Access button within the IAM & Admin panel.
- Specify New Principal: In the New Principals field, input or copy-paste the following service account email address:
- Assign Role: Utilize the filter function to locate and select the BigQuery User role.
- Finalize and Save: Click the Save button to grant the BigQuery User role to the specified service account.
3.Post-Verification Step:
- Confirmation: Following the verification or access granting process, revisit the IAM & Admin panel to confirm the presence of the service account and its assigned role.
- Synchronization Period: Allow a period of up to 24 hours for the access permissions to propagate and synchronize across systems.
As a side note, the service is free, however, to learn more about pricing, check out this article.
With data flowing into BigQuery, you're ready to create your first SQL query!
Type this:
With data flowing into BigQuery, you're ready to create your first SQL query!
Type this:
SELECT * FROM `project-id.dataset-id.events_date`
You need to replace project-id, dataset-id, and date with respective values from your project. The easiest way is to click on the event's three dots, click Copy ID, and paste it inside the backticks.

It should look something like this:
SELECT * FROM `site-search.analytics_446987167.events_20240401`
Then just run it and you'll see a table in the results, but that's not what we really need, it's hard to understand.
Prepare SQL Command
We need to prepare an SQL command beforehand to visualize the old metrics, such as search exit rate or search refinements, in Google Looker Studio.
This is the one you’re going to use a bit later. Just don’t forget to replace project-id and dataset-id.
Prepare SQL Command
We need to prepare an SQL command beforehand to visualize the old metrics, such as search exit rate or search refinements, in Google Looker Studio.
This is the one you’re going to use a bit later. Just don’t forget to replace project-id and dataset-id.
WITH ga4_search_data AS(
 SELECT
   event_date,
   -- The ga_session_id is only unique per user, so we need to concatenate the two
   -- to generate a globally unique session ID
   CONCAT(user_pseudo_id, "#", (SELECT value.int_value from UNNEST(event_params) where key = 'ga_session_id')) AS unique_session_id,
   event_timestamp,
   event_name,
   (SELECT value.string_value from UNNEST(event_params) where key = 'search_term') AS search_term,
   -- Window function to count all page views in a session after this event
   COALESCE(
     SUM(IF(event_name = 'page_view', 1, 0)) OVER (
         PARTITION BY CONCAT(user_pseudo_id, "#", (SELECT value.int_value from UNNEST(event_params) where key = 'ga_session_id'))
         ORDER BY event_timestamp, event_name
         ROWS BETWEEN 1 FOLLOWING AND UNBOUNDED FOLLOWING
     ), 0
   ) AS subsequent_pageviews
 -- Replace <project> and <dataset> with your project id and dataset id
 FROM `project.dataset.events_*`
 WHERE
   -- Parameters DS_START_DATE and DS_END_DATE are replaced by Looker Studio
   (_TABLE_SUFFIX BETWEEN @DS_START_DATE AND @DS_END_DATE) AND
   (event_name = 'page_view' OR event_name='view_search_results')
 ORDER BY 2, 3
)

SELECT
 event_date,
 event_timestamp,
 unique_session_id,
 search_term,
 -- Add the previous search_term as the refined search
 LAG(search_term) OVER (
     PARTITION BY unique_session_id, event_name ORDER BY event_timestamp, event_name
 ) AS search_term_refined,
 -- Subtract the followup pageviews of the next search event to count every
 -- subsequent pageview only once
 COALESCE(
   subsequent_pageviews - LEAD(subsequent_pageviews) OVER (
       PARTITION BY unique_session_id, event_name ORDER BY event_timestamp, event_name
   ),
   subsequent_pageviews
 ) AS pageviews_after_search
FROM
 ga4_search_data
WHERE
 -- Only export search events to our dashboard
 event_name = "view_search_results"
ORDER BY
 1, 3, 2
Create a Beautiful Dashboard in Google Looker Studio
Now, let’s create a report in the Looker Studio. Please keep in mind that we’re going to use SQL commands heavily.
1.Blank Canvas: Hit the ground running with a brand new report in Looker Studio.
2.BigQuery Bridge: Choose BigQuery as your data source to connect to your GA4 data treasure chest.
3.SQL Superpowers: Unleash the power of SQL with "Custom Query" for data shaping and retrieval.
4.Project Pick: Select the GA4 project linked to the BigQuery dataset brimming with your e-commerce data.
5.SQL Magic: Paste your pre-built SQL query (from before) or craft a custom one for your reporting goals.
6.Date Dial: Enable "Enable date range parameters" for on-the-fly date filtering in your report.
7.Finalize & Add: Click "Add" to connect everything and integrate your custom query into your Looker Studio report.
That’s not it. We still have to add custom fields and charts.
Add Custom Fields
Imagine adding custom data points directly within your reports, saving you time and effort. With calculated columns, you can transform existing data from your source using powerful query-side functions. These custom fields become especially handy when you reference the same calculation across multiple reports.
Session ID with Search Term
1.Access Data Tab: Find the Data tab to access data field settings and modifications.
2.Initiate Field Addition: Locate and click on the Add a field button and choose Add calculated field.
3.Assign Field Name: Provide a clear and descriptive name for the calculated field, such as "Session ID with Search Term."
4.Input Formula: In the formula field, enter the following expression:
CONCAT (unique_session_id, "#", search_term)
5.Save Calculated Field: Click the Save button to finalize the creation of the calculated field and incorporate it into your report's data schema.

Is Refinement
1.Access Data Tab: Navigate to the Data tab to manage and modify data fields.
2.Initiate Field Addition: Click on the Add a field button and choose Add calculated field.
3.Assign Field Name: Name the calculated field "Is Refinement."
4.Input Formula: In the formula field, enter the following expression:
(search_term_refined IS NOT NULL) AND (search_term != search_term_refined)
5.Save Calculated Field: Click the Save button to finalize the creation of the "Is Refinement" calculated field and incorporate it into your report's data schema.

Add Charts
Now, when we are done with custom fields, we can create beautiful data charts.
1.Access the Insert Menu: Navigate to the "Insert" menu situated within the topmost navigation bar of Looker Studio.
2.Select Time Series Chart: Choose the "Time Series Chart" option from the available chart types to visualize data points over time.
3.Incorporate Data Fields: Leverage the drag-and-drop functionality to directly add relevant fields from the dedicated "Data" tab onto the chart surface.
4.Add Metric Button (Alternative): Click the "Add Metric" button within the "Metrics" section of the "Chart" tab.


Sessions with Search
1.Find the Metric: Identify the metric named "unique_session_id."
2.Activate the Edit Menu: Click on the pencil icon to the right of the metric.
3.Craft a Clear Name: Within the edit window, enter a name "Sessions with Search"
4.Copy-Paste: Replicate the rest of the picture.
1.Find the Metric: Identify the metric named "unique_session_id."
2.Activate the Edit Menu: Click on the pencil icon to the right of the metric.
3.Craft a Clear Name: Within the edit window, enter a name "Sessions with Search"
4.Copy-Paste: Replicate the rest of the picture.


All Searches
1.Find the Metric: Identify the metric named "Record Count."
2.Activate the Edit Menu: Click on the pencil icon to the right of the metric.
3.Craft a Clear Name: Within the edit window, enter the name "All Searches."
4.Copy-Paste: Replicate the rest of the picture.
1.Find the Metric: Identify the metric named "Record Count."
2.Activate the Edit Menu: Click on the pencil icon to the right of the metric.
3.Craft a Clear Name: Within the edit window, enter the name "All Searches."
4.Copy-Paste: Replicate the rest of the picture.


Unique Searches
1.Find the Metric: Identify the metric named "Session ID with Search Term."
2.Activate the Edit Menu: Click on the pencil icon to the right of the metric.
3.Craft a Clear Name: Within the edit window, enter the name "Unique Searches."
4.Copy-Paste: Replicate the rest of the picture.
1.Find the Metric: Identify the metric named "Session ID with Search Term."
2.Activate the Edit Menu: Click on the pencil icon to the right of the metric.
3.Craft a Clear Name: Within the edit window, enter the name "Unique Searches."
4.Copy-Paste: Replicate the rest of the picture.


Pageviews/Search
1.Add New Metric: Click on the Add Metric button and Add Field button.
2.Craft a Clear Name: Within the edit window, enter the name "Pageviews/Search."
3.Input Formula: In the formula field, enter the following expression:
1.Add New Metric: Click on the Add Metric button and Add Field button.
2.Craft a Clear Name: Within the edit window, enter the name "Pageviews/Search."
3.Input Formula: In the formula field, enter the following expression:
SUM (pageviews_after_search) / COUNT_DISTINCT (Session ID with Search Term)
5) Copy-Paste: Replicate the rest of the picture.


Search Exit Rate
1.Add New Metric: Click on the Add Metric button and Add Field button.
2.Craft a Clear Name: Within the edit window, enter the name "Search Exit Rate."
3.Input Formula: In the formula field, enter the following expression:
1.Add New Metric: Click on the Add Metric button and Add Field button.
2.Craft a Clear Name: Within the edit window, enter the name "Search Exit Rate."
3.Input Formula: In the formula field, enter the following expression:
SUM ( IF (pageviews_after_search=0,1,0)) / COUNT (Session ID with Search Term)
4.Choose the Right Type: Pick “Percent.”
5.Copy-Paste: Replicate the rest of the picture.
5.Copy-Paste: Replicate the rest of the picture.


Search Refinement Rate
1.Add New Metric: Click on the Add Metric button and Add Field button.
2.Craft a Clear Name: Within the edit window, enter the name "Search Refinement Rate."
3.Input Formula: In the formula field, enter the following expression:
1.Add New Metric: Click on the Add Metric button and Add Field button.
2.Craft a Clear Name: Within the edit window, enter the name "Search Refinement Rate."
3.Input Formula: In the formula field, enter the following expression:
SUM ( IF (Is Refinement,1,0)) / Record Count
4.Choose the Right Type: Pick “Percent.”
5.Copy-Paste: Replicate the rest of the picture.
5.Copy-Paste: Replicate the rest of the picture.


Final Look
This current view offers valuable insights, but let's explore how we can elevate its functionality with two key features: a dynamic date range picker and a dedicated data table.
Dynamic Date Exploration:
Imagine being able to effortlessly switch between different timeframes and analyze your data for specific periods. Look for the "Insert" menu within Looker Studio and click on "Date Range Control." This will introduce a handy date picker directly onto your dashboard. Now you can select the specific dates you want to focus on, allowing for a more dynamic exploration of your data.
Unveil Underlying Data with a Table:
Want to delve deeper into the raw numbers behind your visualizations? Navigate back to the "Insert" menu and click on "Table." This will incorporate a dedicated data table within your dashboard. Remember the report-building principles you mastered in GA4, and feel free to leverage the familiar formulas you already applied in Looker Studio. This table will provide a detailed breakdown of the data powering your visualizations, offering additional insights for further analysis.

Step 3: Data Analysis
So, how to measure search effectiveness? Now that you have all the data, it's time to bring up clearly defined site search goals. Let's look at a few methods for understanding metrics.
Semantic Search
- Time Series Analysis: Look at visualized trends on a timeline in Google Looker Studio. Look for seasonal variations or spikes in activity that might correlate with marketing campaigns, product launches, or website updates.
- Growth Rate Analysis: Calculate the change in your metrics over different periods, such as weekly or monthly reports, to see if search activity is increasing, decreasing, or remaining stable.

Analyze Correlations Between Metrics
- Scatter Plots: Create scatter plots to visualize the relationship between two metrics, let’s say, Sessions with Search and Pageviews After Search. Generally, metrics tend to increase or decrease together.
- A positive correlation (data points generally trending upward) suggests that sessions with a higher number of searches tend to have more pageviews after the search. This could indicate:
- Users who actively search are more engaged and explore more content.
- The search function effectively leads users to relevant content that keeps them interested.
- A negative correlation (data points trending downwards) suggests that sessions with a higher number of searches tend to have fewer pageviews after the search. This could indicate:
- Users who perform many searches might be struggling to find the information they need.
- Search results might not be very relevant, leading users to abandon their search quickly.
- If there's no clear upward or downward trend, it's difficult to draw a definitive conclusion. However, you might see clusters of data points:
- High Search, High Pageviews: This could represent successful searches leading to deeper exploration of relevant content.
- High Search, Low Pageviews: This might indicate users performing many searches but not finding what they need.
- Low Search, High Pageviews: This scenario suggests users are finding what they need without searching. This could be due to strong brand recognition, effective content marketing, or casual browsing.
- Low Search, Low Pageviews: This could represent users browsing the site without needing to search or users with unsuccessful searches.

Segment Data for Deeper Insights
- Search Terms: Analyze which search terms lead to the highest number of search exits or refinements. This can help identify potential information gaps or areas where search results need improvement.
- Pages: Analyze search metrics for specific pages reached through search. Are users dropping off quickly from certain landing pages after a search? This might indicate a mismatch between search intent and the landing page's content.

Step 4: Site Search Optimization
After analyzing the abovementioned metrics, you may be lost on what to do next. What if the metrics are poor, and your site search is far from being perfect? Then we have a few suggestions on improving your site search with Searchanise Search & Filter. It’s a Shopify app with all the tools to boost your search relevance, drive your conversion rates, bring you money, and improve user experience in your Shopify store. Let’s see what can be done to improve your search in most cases.
A Low Number of Sessions With Search
A dip in search sessions could signal a hidden obstacle in your website's search experience. Let's delve into strategies to empower your users:
Spotlight the Search Bar: Is your search bar easily discoverable? Don't leave it lurking in the shadows. Position it strategically to make it the first port of call for users seeking information.
Streamline Search Refinement: Imagine users typing queries and receiving instant suggestions as they go. This is the magic of search suggestions and autocomplete functionalities. By implementing these features, you refine searches in real-time, leading to more accurate results and a smoother user journey.
By prioritizing user-centric design for your search bar, you unlock a stress-free search experience. This translates to happier customers who can easily find what they need, ultimately boosting user satisfaction and engagement.

A High Number of Search Exits
Customers abandoning your site after searching can be a mystery. Perhaps they couldn't find what they needed, leading to frustration and a quick exit. The answer lies in leveraging AI personalization to refine search results based on user queries.
Empowering Personalized Search: Imagine a world where search results adapt to individual needs. This is the magic of data-driven personalization. AI personalization can analyze search queries that lead to exits and refine search results for those terms. This allows you to tailor results, eliminating irrelevant content and streamlining the user journey. Frustration fades away, replaced by happy customers who effortlessly find what they're looking for.
The benefits are clear. By prioritizing a user-centric search experience, you unlock a surge in conversions and sales. Satisfied customers who find what they need become loyal patrons, returning to you.

Learn how to drive sales with modifications in this blog post.
High Search Refinements
Encountering a high number of search refinements can indicate user frustration. Here's how to address it:
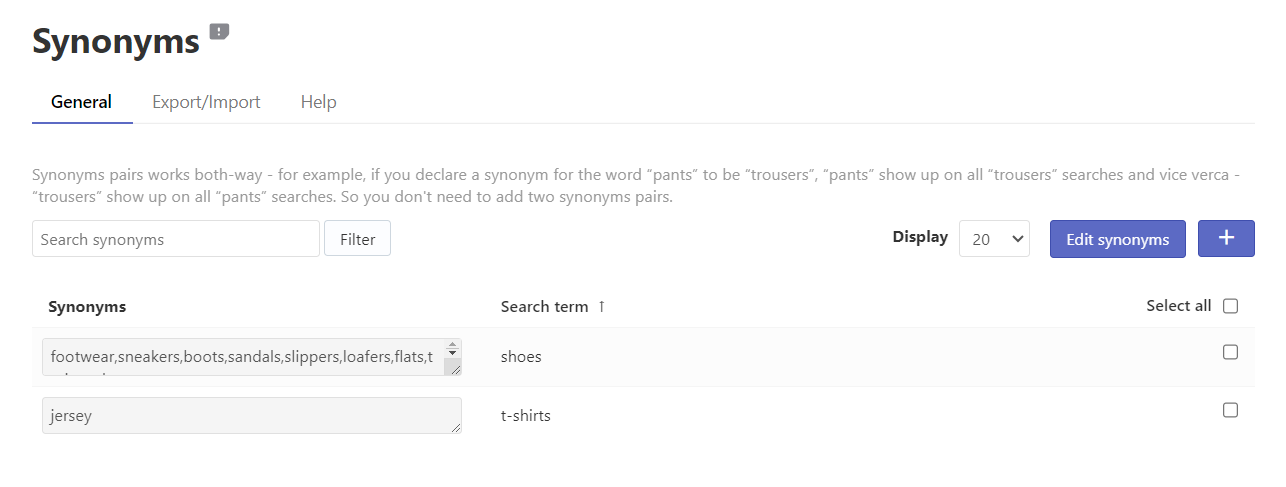
Expand Your Search Vocabulary: Consider incorporating synonyms into your search functionality alongside autocomplete features. This broadens the reach of your search engine and helps users find what they need, even if they don't use the exact term.
Analyze Refinement Trends: Don't ignore those search refinements! Analyze the queries with the highest refinement rates. This valuable data helps you identify potential gaps in your search terminology and allows for targeted improvements.
By implementing these proactive strategies, you can tame "search fatigue" and ensure a smoother exploration experience for your users. This translates to increased user satisfaction and a higher likelihood of them finding what they're looking for on your website.
Low Time After Search
Customers leaving your shop after searching can be a serious red flag. What's the cause? Disappointment from search results that aren't relevant. Here's how to win them back:
Understand User Behavior: Delve into user behavior on your search results page. What usability issues might be hindering their experience? Analyzing this data helps identify and address any roadblocks that prevent users from finding what they need.
A/B Test for Improvement: Don't be afraid to experiment! Try A/B testing different search result layouts. This allows you to optimize the information displayed and find the layout that resonates most with your users, leading to improved user engagement.
Empower with Filters: Imagine empowering your users to narrow down their search with ease. That's the power of filters! By allowing users to filter results based on specific criteria, you expedite their search process and increase the likelihood of them finding relevant content quickly. This fosters a deeper dive into your product categories and, ultimately, a more satisfying shopping experience.
By following this advice, you can transform your search functionality from a source of frustration to a tool that gives relevant results to your customers. This translates to a happier customer base, increased engagement, and, ultimately, a boost in sales.

Wrapping Up
Answering the question "how to measure search performance," we found a way to understand and optimize this crucial element of your online shop. We explored Google Analytics 4, BigQuery, and Looker Studio, finding tools to analyze user search behavior and uncover hidden patterns.
While GA4 provides a solid foundation, the combined power of BigQuery and Looker Studio elevates the level of analysis by giving you access to a richer data set, including cherished metrics from the Universal Analytics era. This depth of insight allows you to make data-driven decisions, transforming site search from a simple function to a finely tuned tool for customer satisfaction and conversions.
However, the journey doesn't end at analysis. To unlock the potential of site search, consider a solution like Searchanise Search & Discovery. This app offers a full suite of features designed to solve the challenges of site search, bridging the gap between knowledge and action.
By combining GA4's analytics capabilities with Searchanise's optimization capabilities, you can create a site search experience that goes beyond mere functionality. It will become a passageway to delighting customers, increasing conversions, and ultimately guiding your e-commerce venture to enduring success.
Install Searchanise and watch your conversation boost


“Rock solid performance! I wish we knew about this app a year ago! The intuitive nature of the searches and speed of information make this a perfect app for our web store."
"Works great for our needs!
The Searchanise plugin/service excels where other leading (and much more expensive) search providers have fallen short on our site. We have over 17,000 products and this plugin indexes them flawlessly and creates a top-notch search experience for our customers. Really pleased that we found this one."
The Searchanise plugin/service excels where other leading (and much more expensive) search providers have fallen short on our site. We have over 17,000 products and this plugin indexes them flawlessly and creates a top-notch search experience for our customers. Really pleased that we found this one."
My last hope was to try Searchanise. I was, and I am still amazed! The search results are PERFECT! The sync speed is AMAZING without bags or delays. And I have never seen such great support. The Searchanise App is HIGHLY RECOMMENDED, and I really hope someday to find again such a nice team and support."
"Searching for a Search app? Try Searchanise. We are totally impressed, works great, it's faster than the default BC search and looks gorgeous in our shop - it's form and function! Supported by wonderful people. Many thanks to Alexey and the team! Excellent app and awesome team"
"The results are fantastic.
We use it on many customers and they are all satisfied. It greatly enhances Magento's search."
We use it on many customers and they are all satisfied. It greatly enhances Magento's search."
"I could say a lot of great things about this add-on, but I think this one line suffices; adding the Searchanise feature to your store is one of the most important and rewarding decisions you will make for your business and customers. Not to mention, the team is an absolute delight to work with, namely Angelina Morozova!"
Roman
Senior Content Marketing Manager at Searchanise